TL;DR
- Install VSCode plugin
Remote Development(be it container or SSH), and installLLDB DAPin the remote environment - Install
lldbin source code environment - Build the project with debug symbols
- Configure
.vscode/launch.json{ "version": "0.2.0", "configurations": [ { "type": "lldb-dap", "request": "launch", "name": "Launch", "program": "${workspaceRoot}/<your program>", "args": [], "env": [], "cwd": "${workspaceRoot}" } ] }
Explained
Modern debuggers employ client/server architecture to provide debugging features. The architecture is shown below, using lldb as an example.
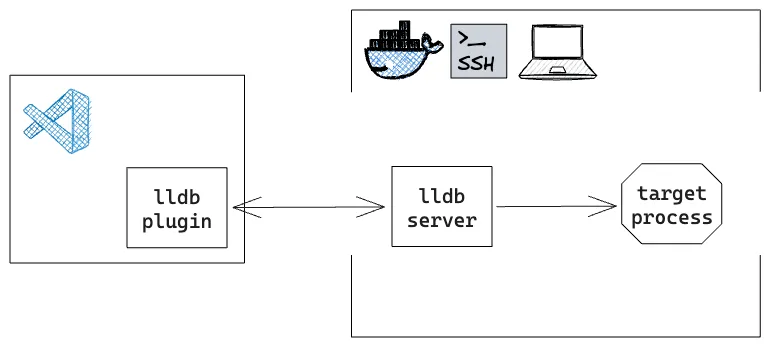
The debugger client (e.g. VSCode) sends commands to the debugger server (e.g. lldb) and receives the results. The debugger server interacts with the target program and provides the results back to the client. Then the debugger client displays the results to the user.
lldb is a debugger for C/C++, based on the LLVM project. To debug a program with lldb, you need to build the program with debug symbols.